Visualization Apps
The applications below contain collected GPCR-lipid protein interactions data. The current dataset
contains information on 28 different GPCRs, and we hope to add more soon. All of the data presented here and
contained in the application below is part of the following work:
Link to the article
We will add support for exporting and downloading the data very soon!
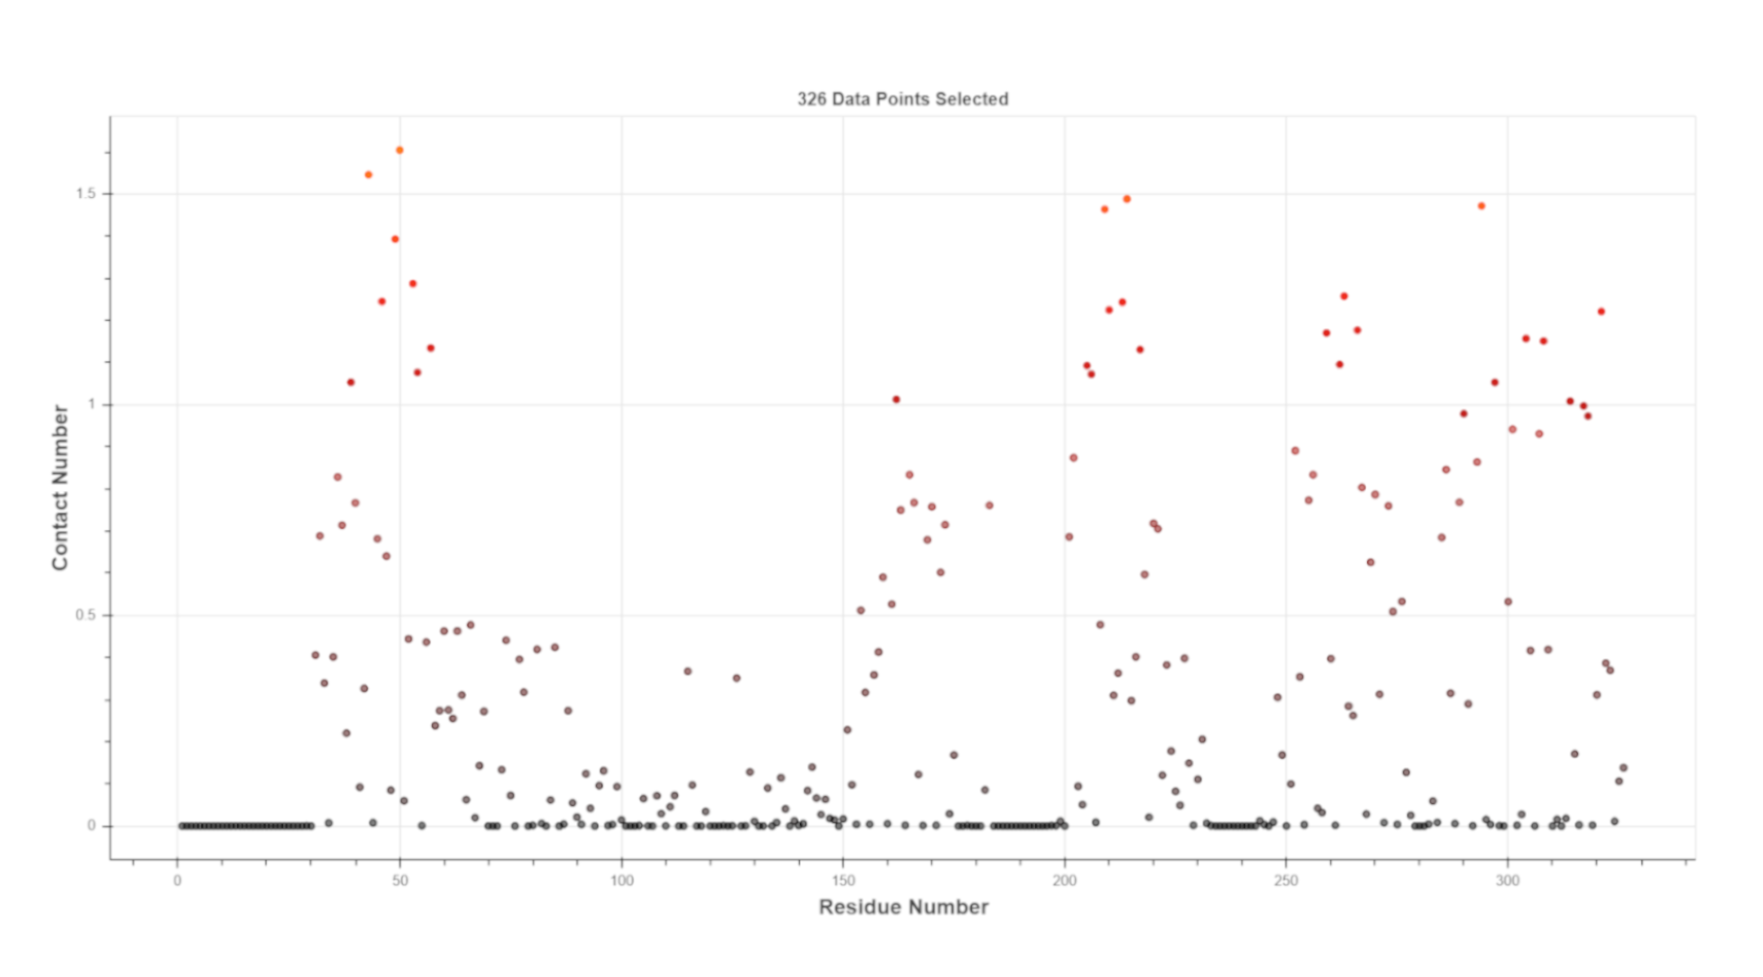
Point Distribution
Interactions visualized as a point plot where each point represents the interaction of one residue with a particular lipid.
Explore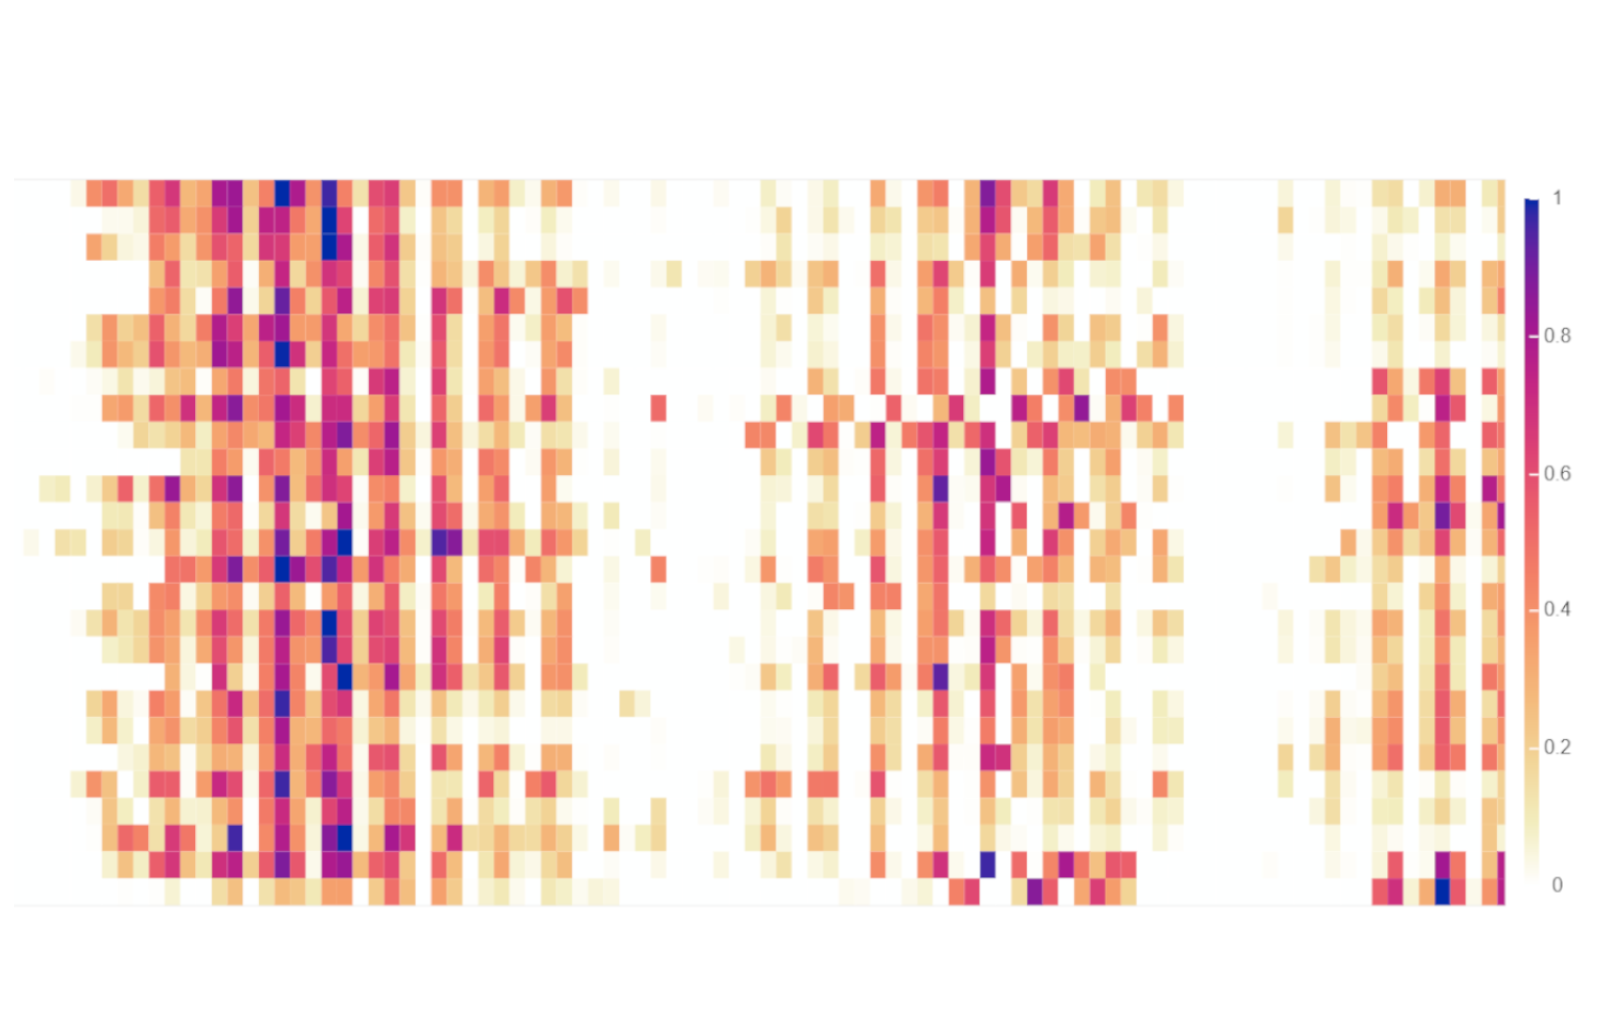
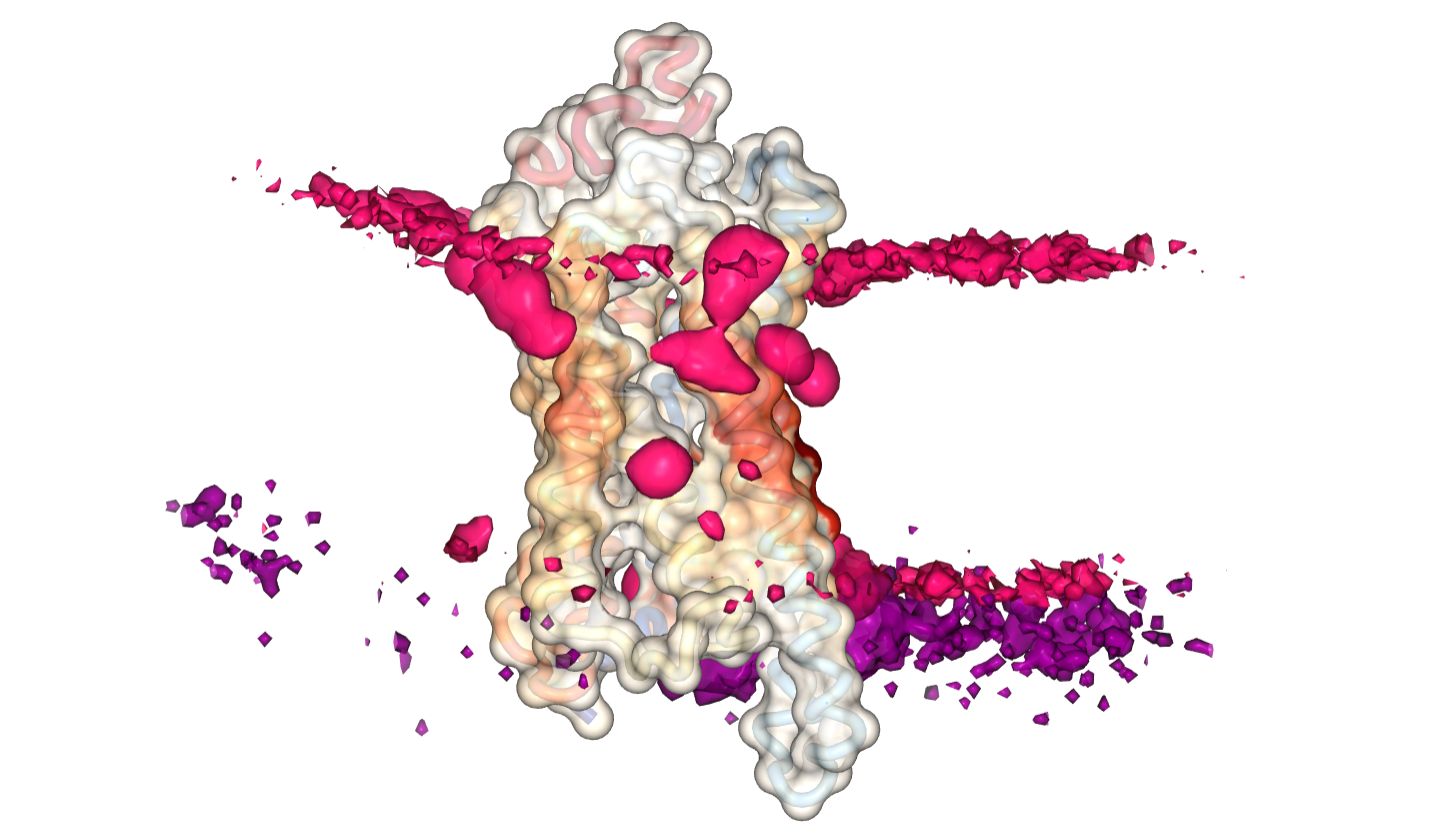
Heatmap Viewer
Interactive 3D visualization of lipid densities and projected contact heatmaps onto the surface of proteins.
Explore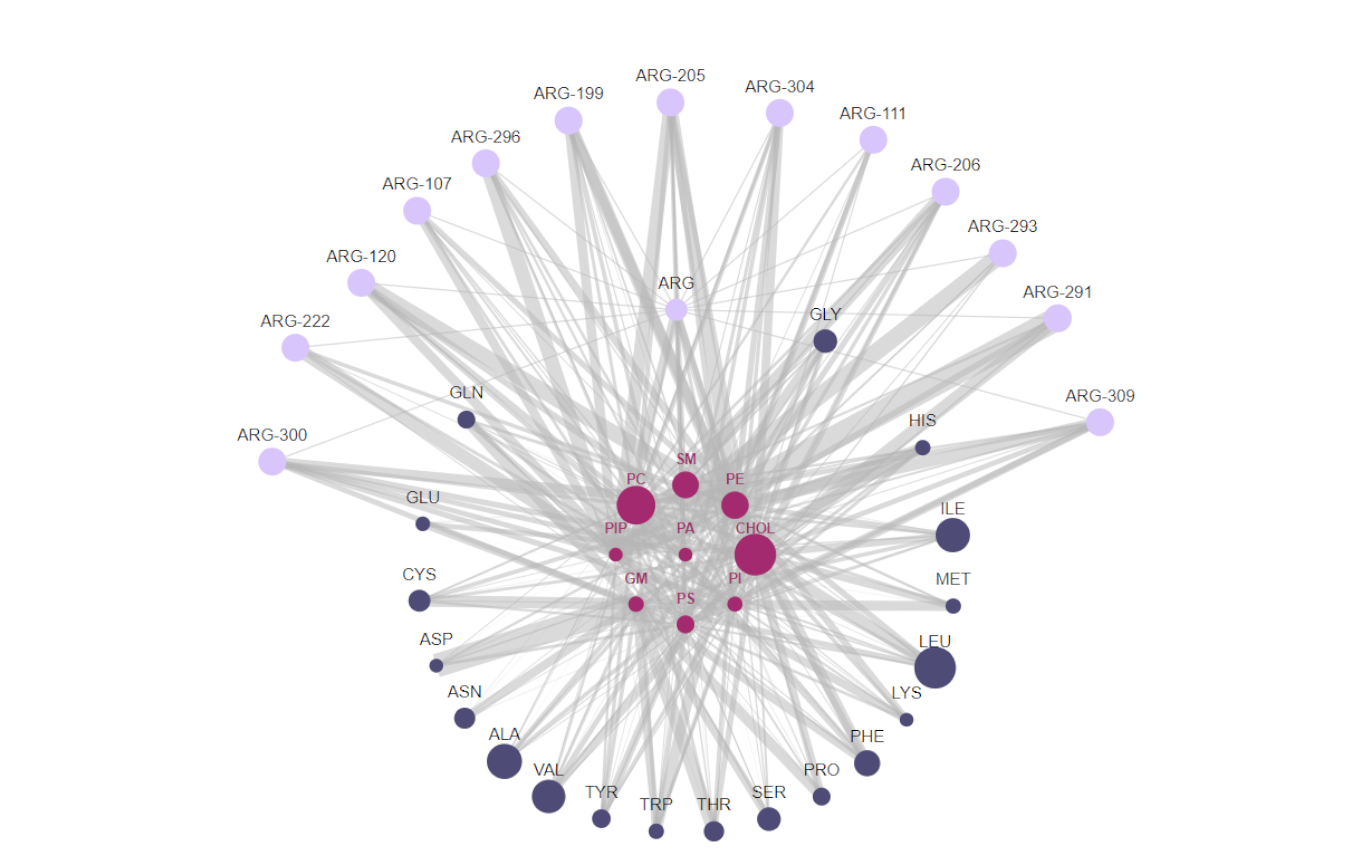
Network Graph
Lipids/proteins are represented as collapsible nodes and their interactions with each other as edges.
Explore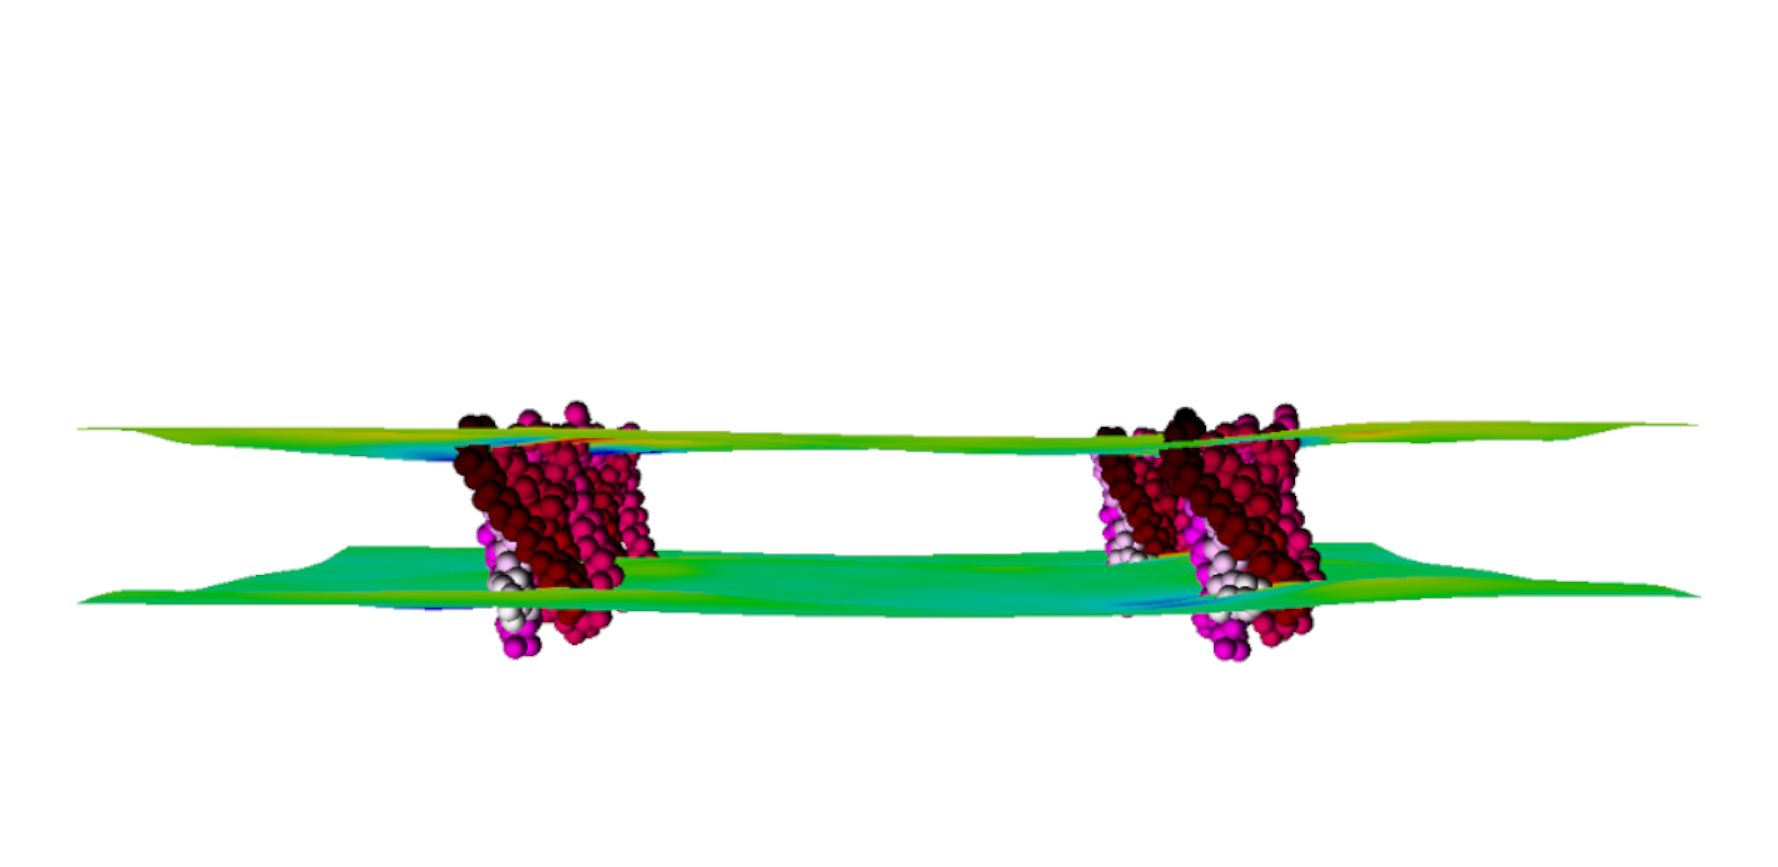
Thickness & Curvature
The changes that proteins induce in their surrounding lipid environment are displayed using thickness and curvature mesh files.
Explore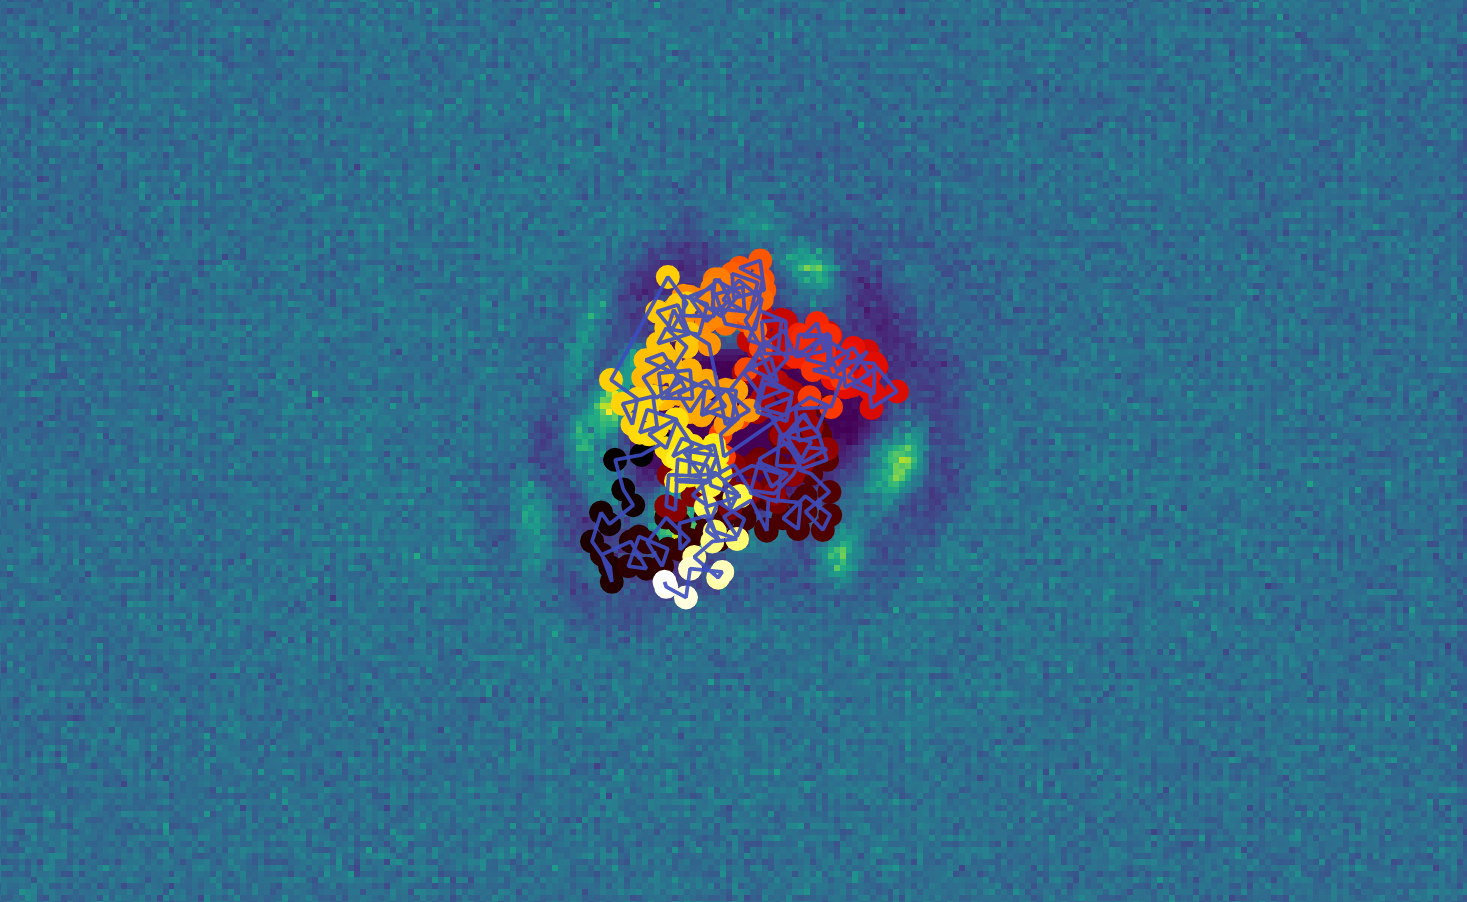
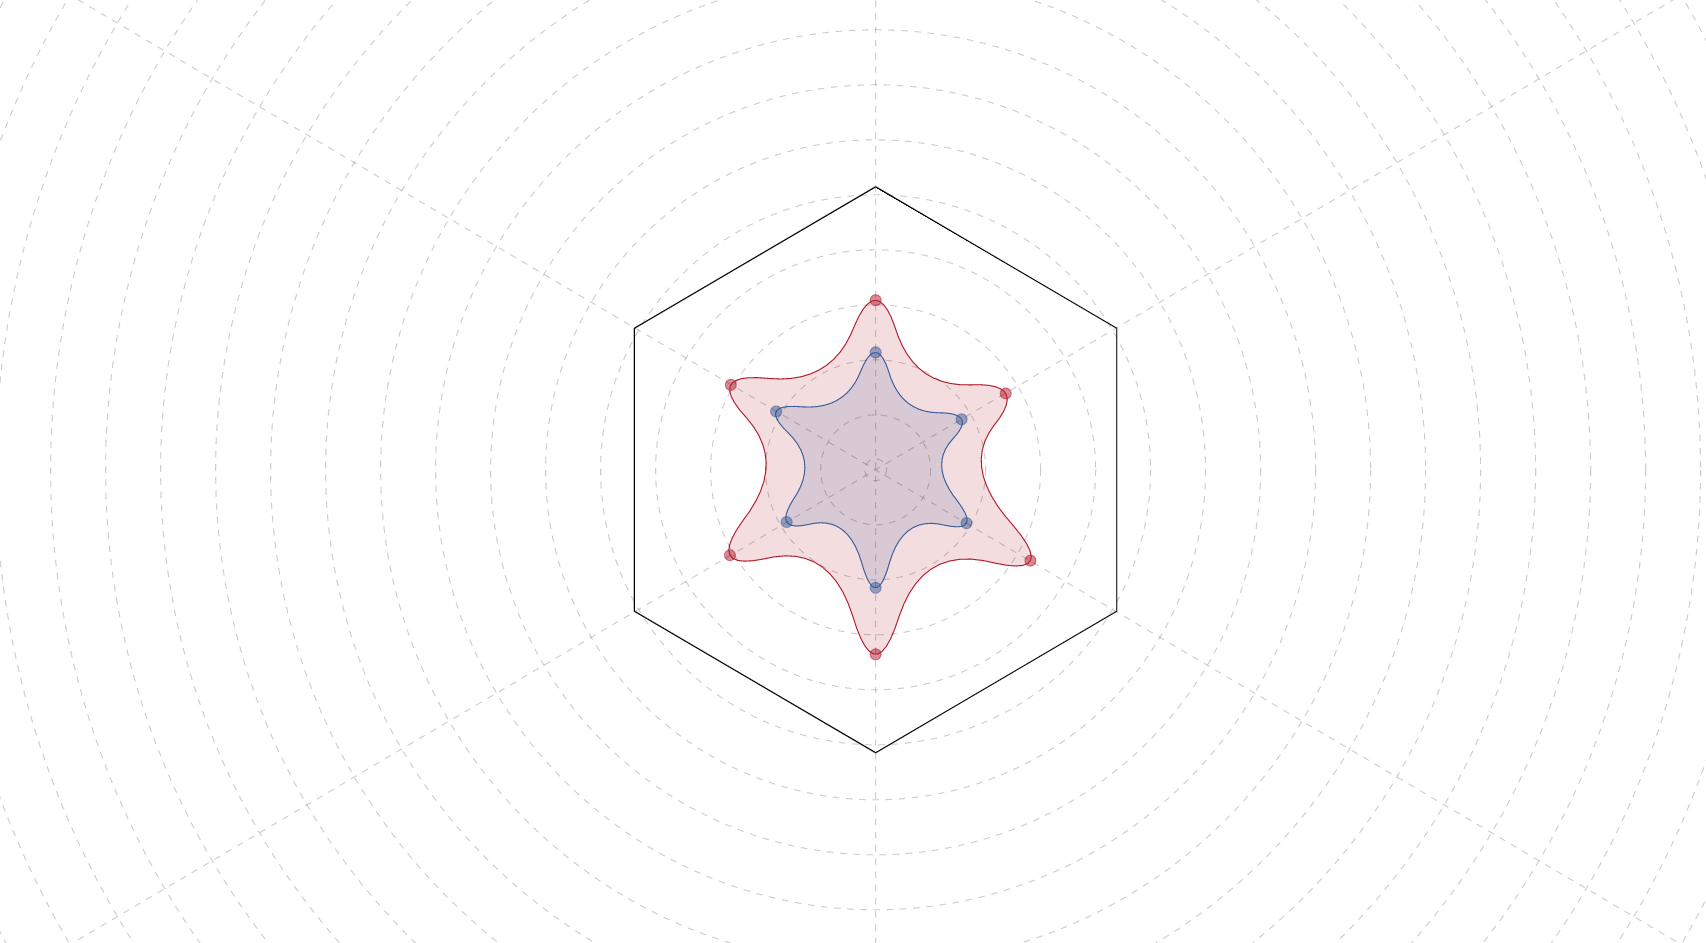
Metric Comparison
Per residue comparison of calculated contact metrics. Employs an interactive radar plot to display values.
Explore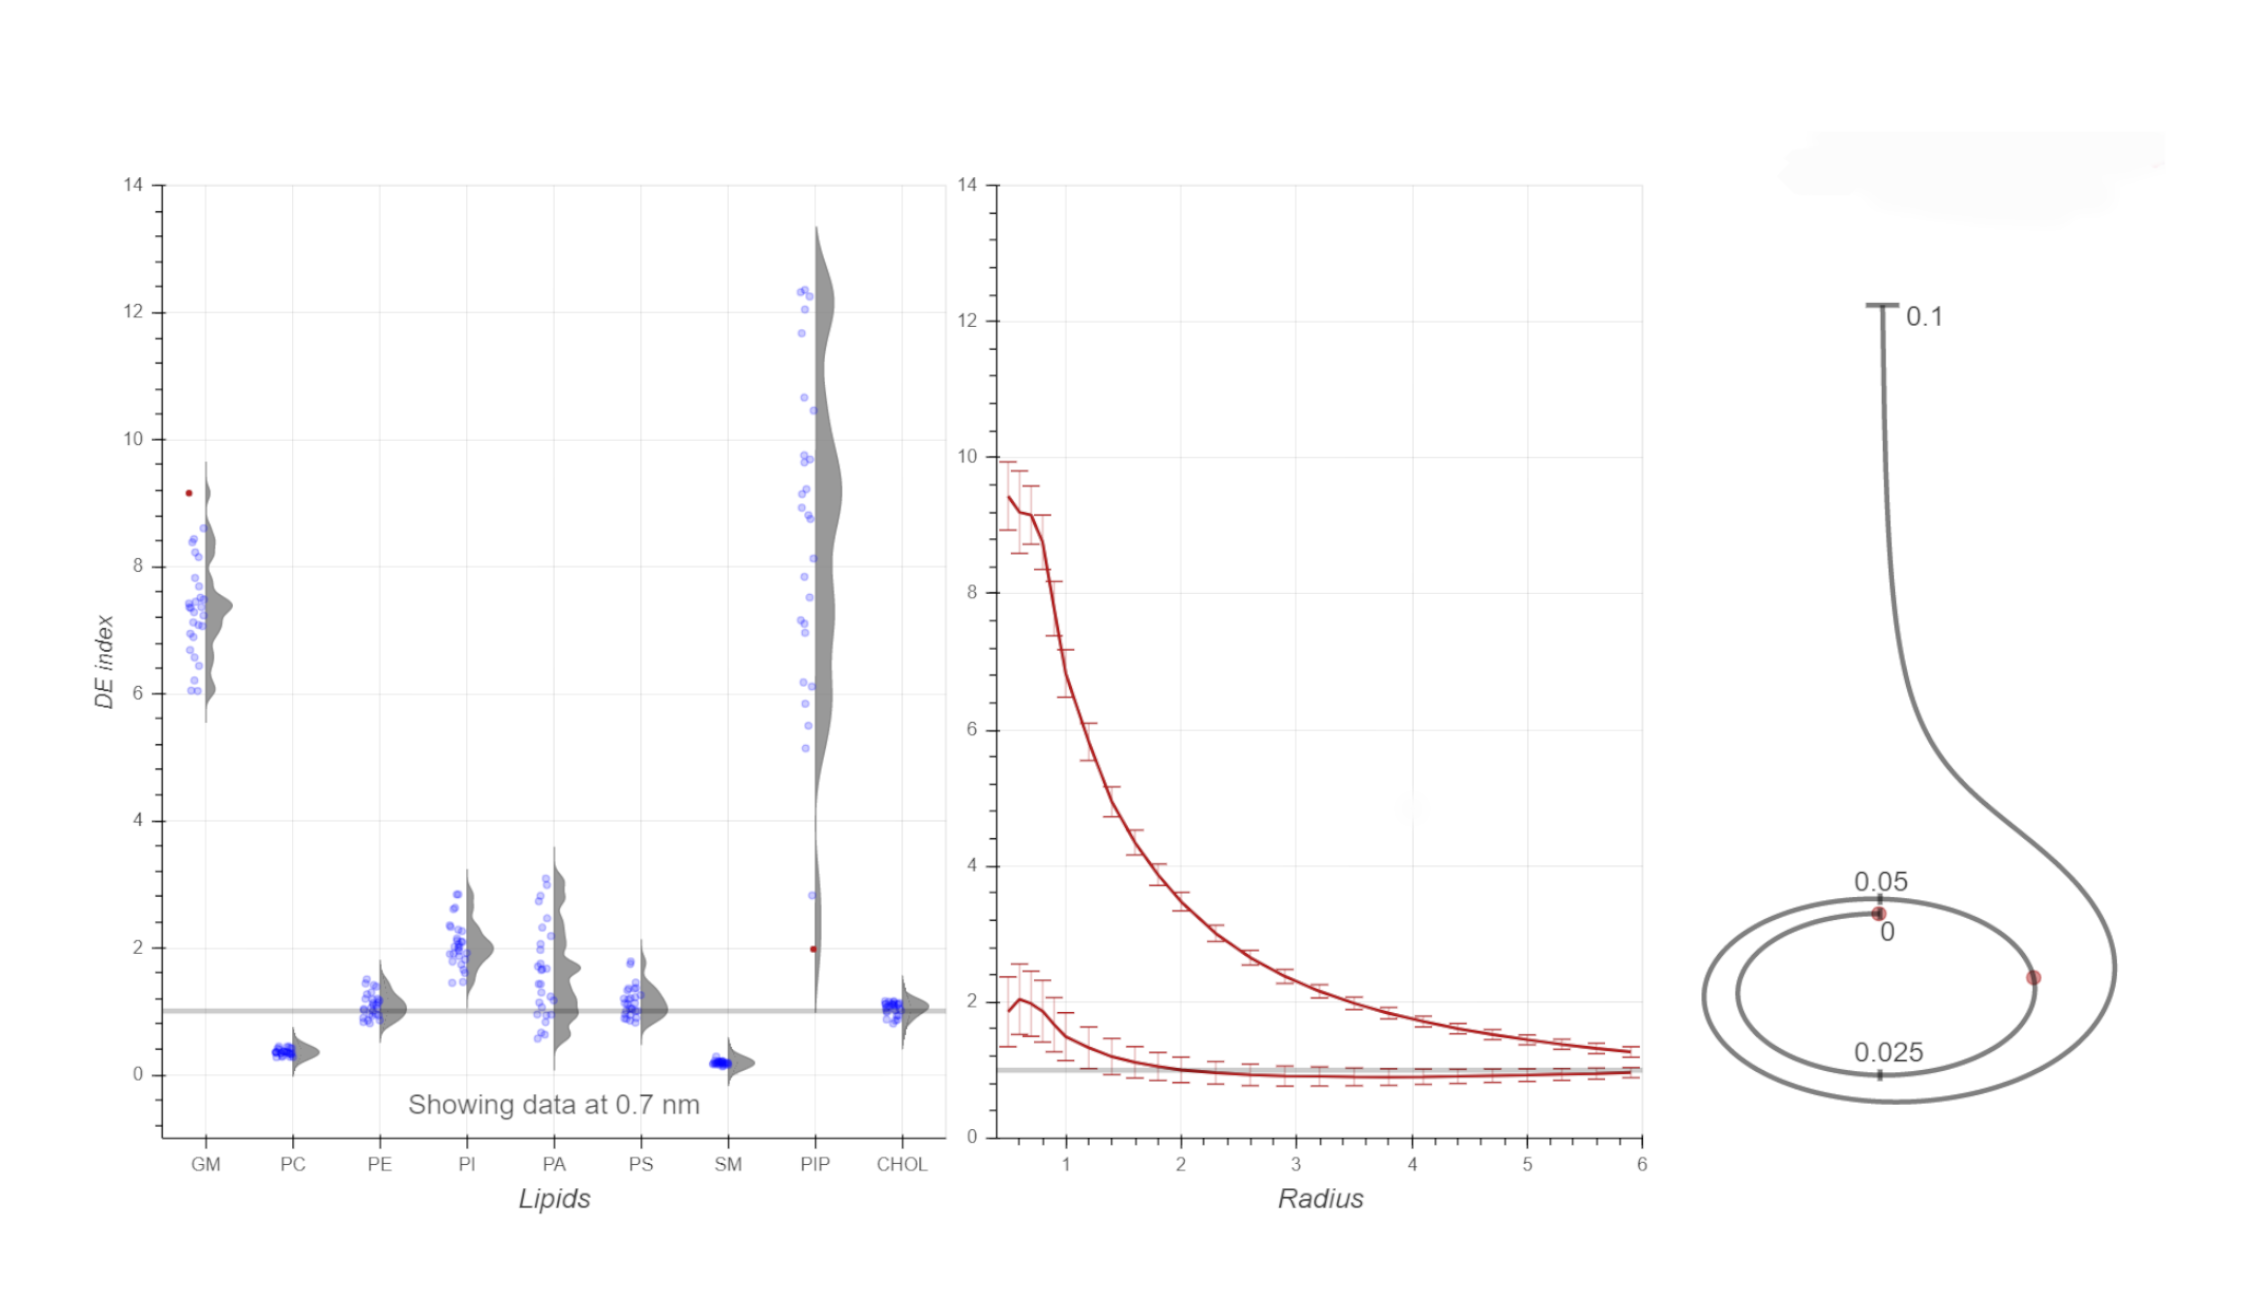
Error Bars and p-values
Application visualizing different statistical parameters as well as allowing the user to select and compare values between different proteins.
Explore