Visualization Apps
Each card below corrspond to a separate but unique application that displays calculated lipid-protein interactions from your submitted system. A description of each application, what they measure and what they show is given in the Help pages of this website as well as summarized over each application.
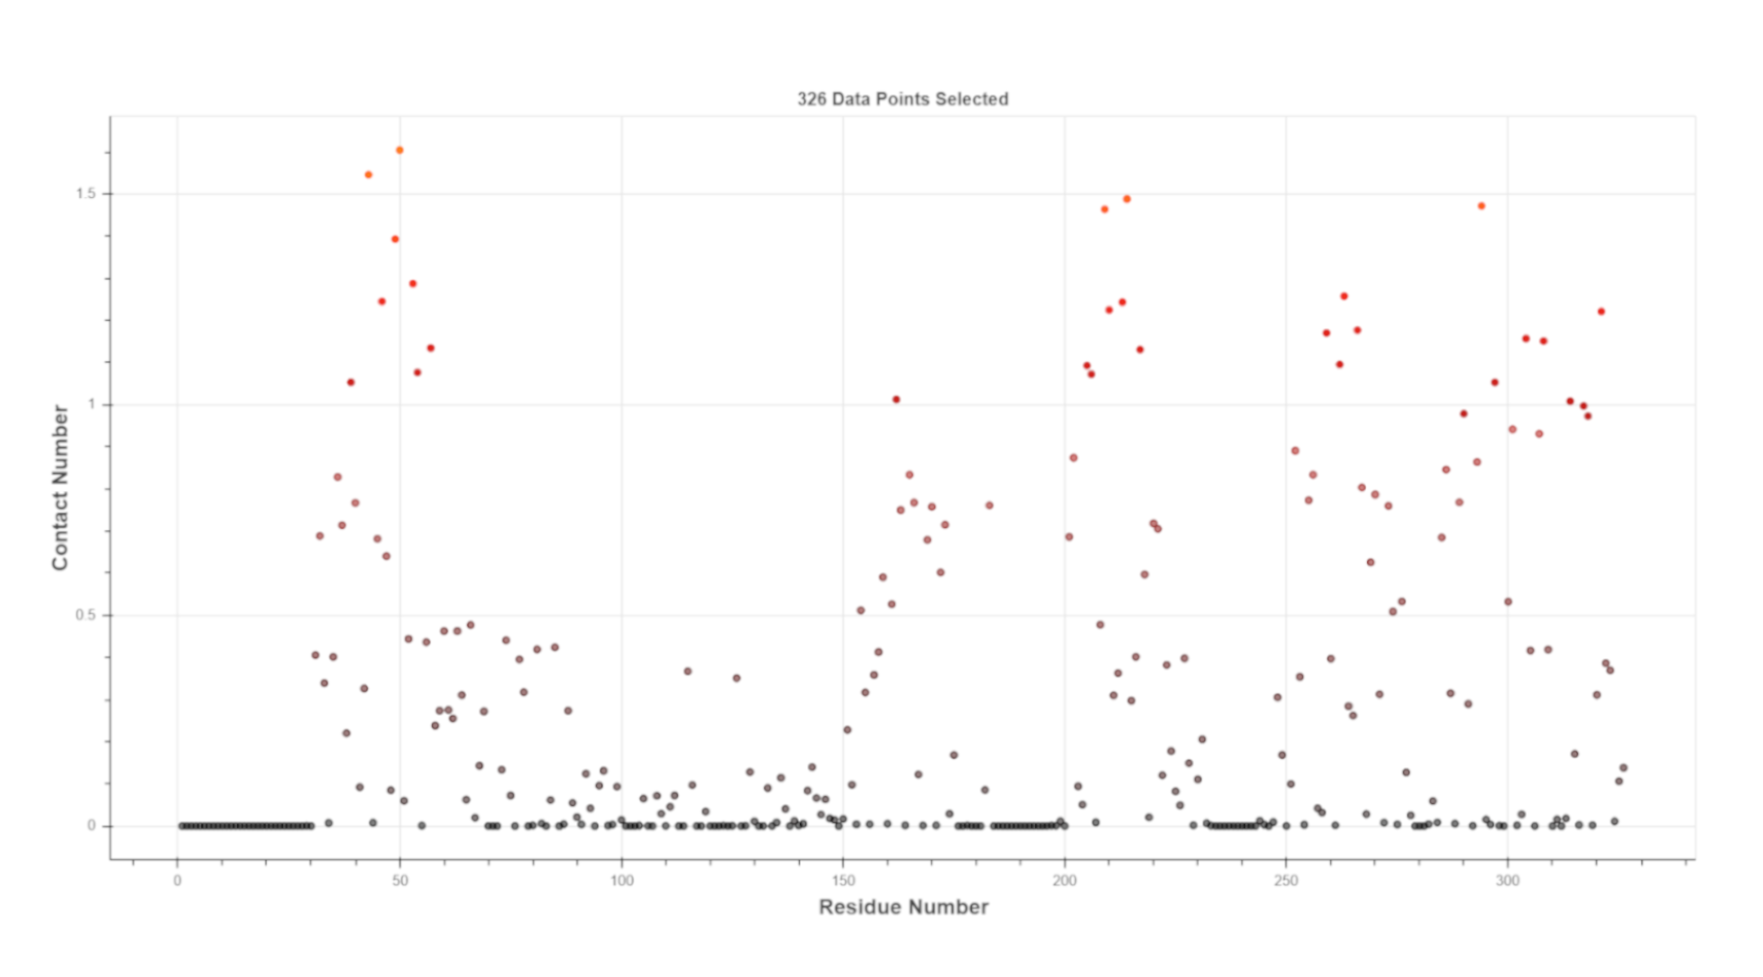
Point Distribution
Interactions visualized as a point plot where each point represents the interaction of one residue with a particular lipid.
Explore
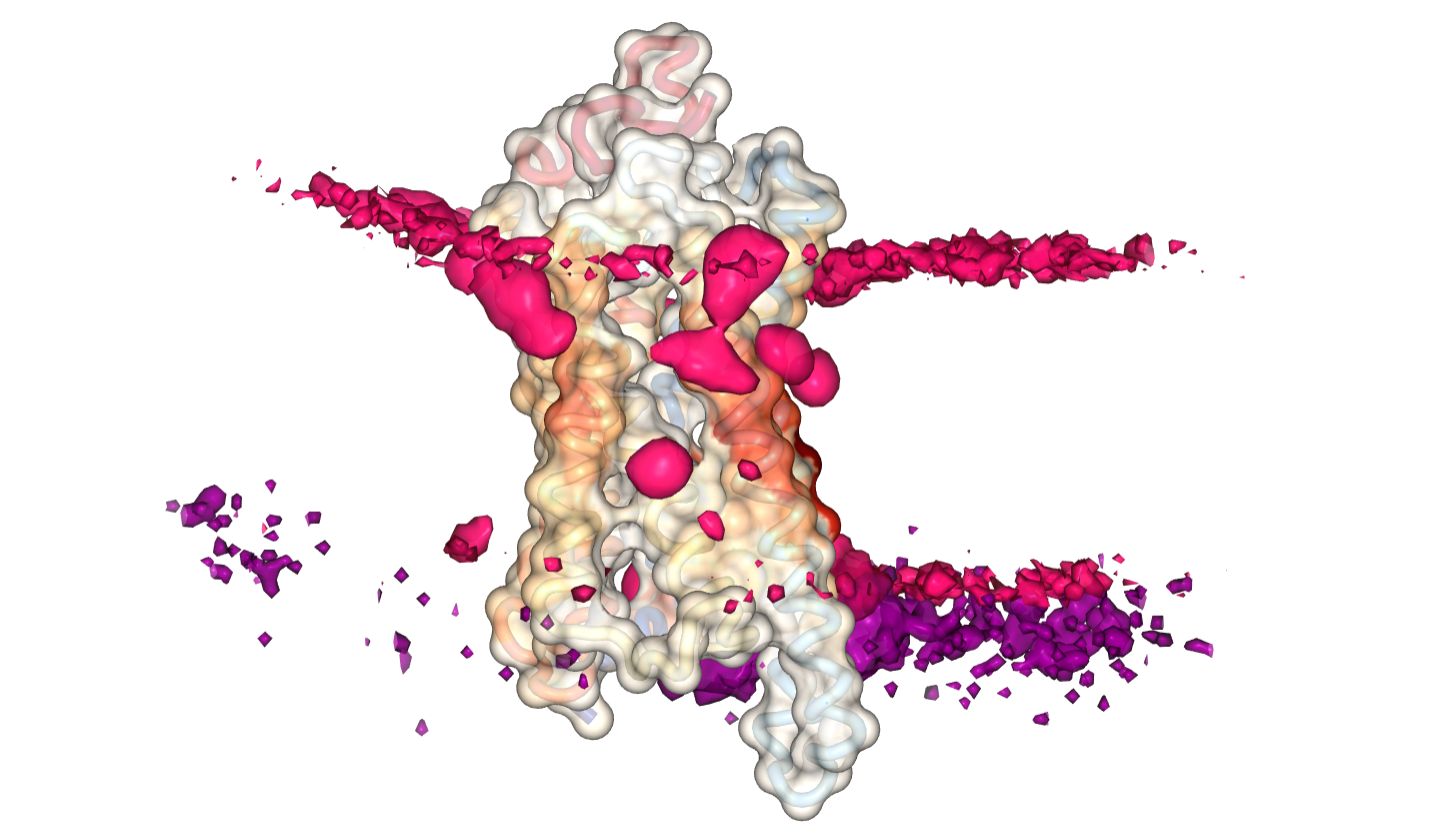
Heatmap Viewer
Interactive 3D visualization of lipid densities and projected contact heatmaps onto the surface of proteins.
Explore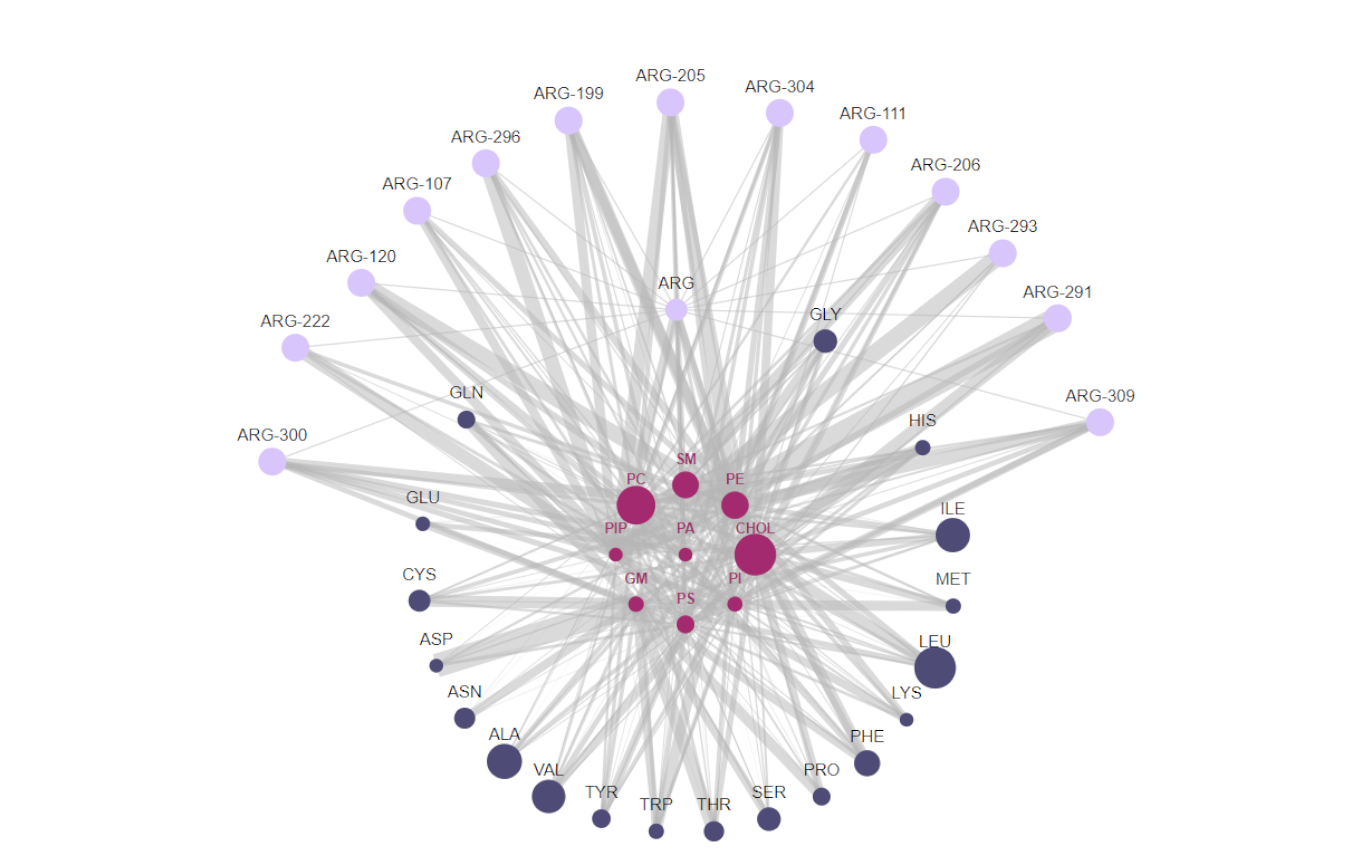
Network Graph
Lipids/proteins are represented as collapsible nodes and their interactions with each other as edges.
Explore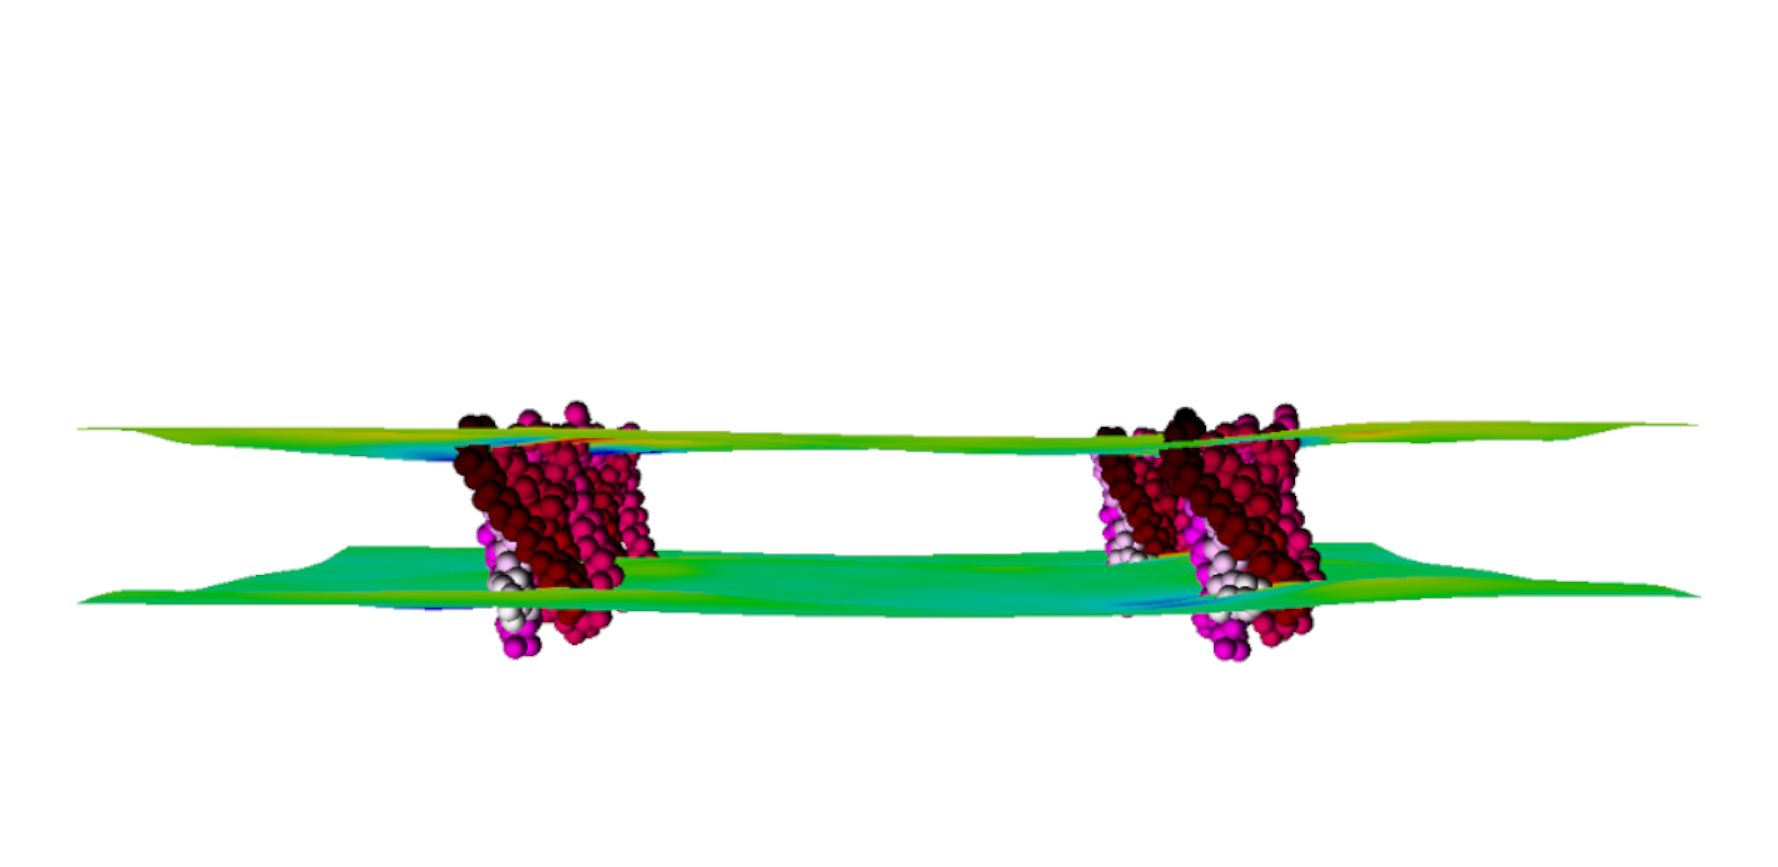
Thickness & Curvature
The changes that proteins induce in their surrounding lipid environment are displayed using thickness and curvature mesh files.
Explore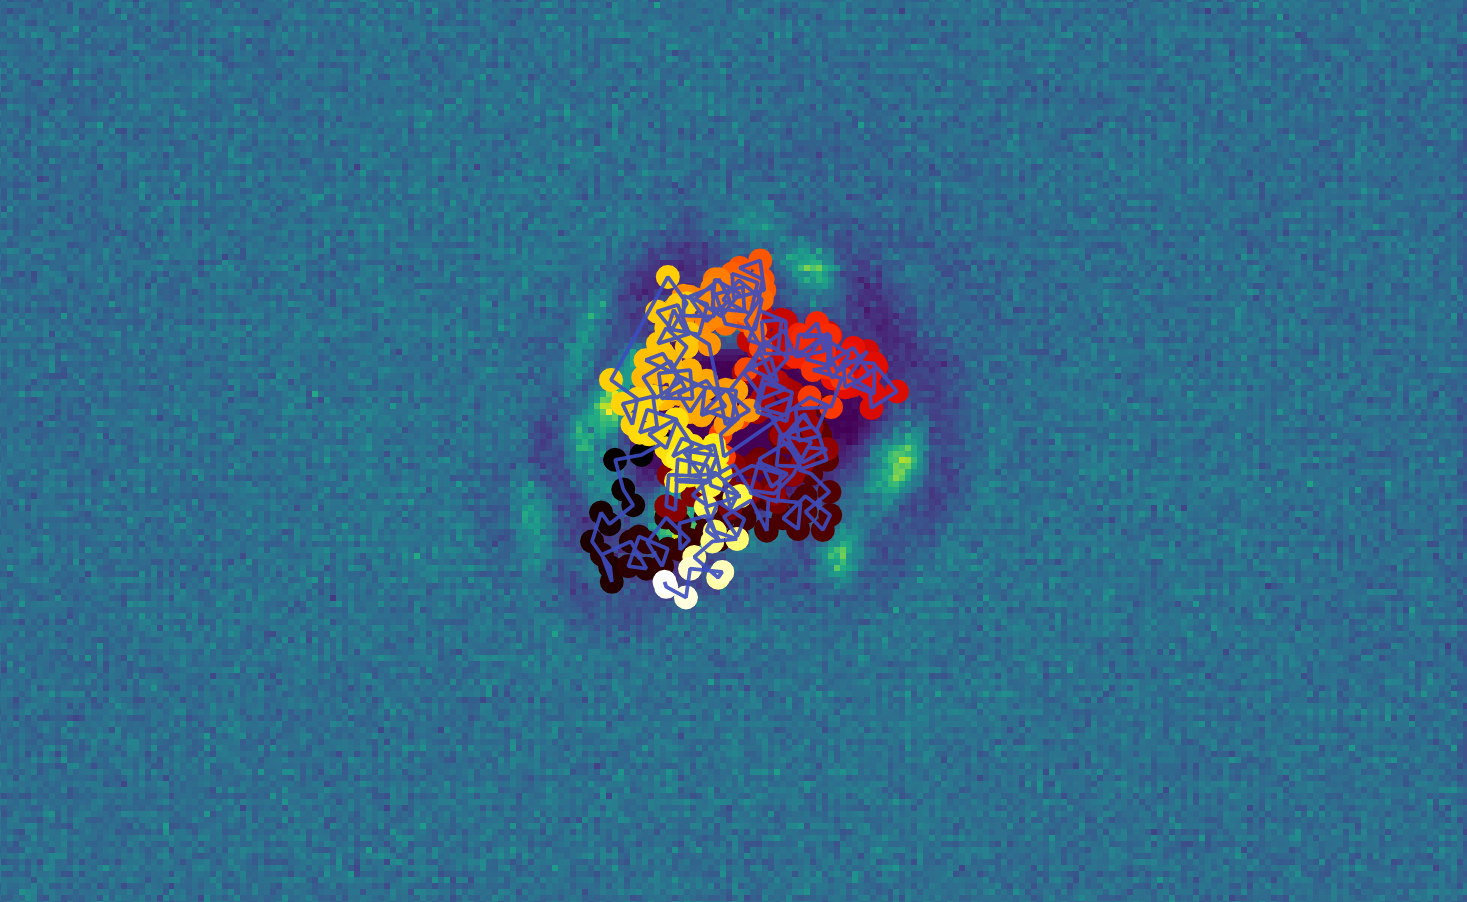
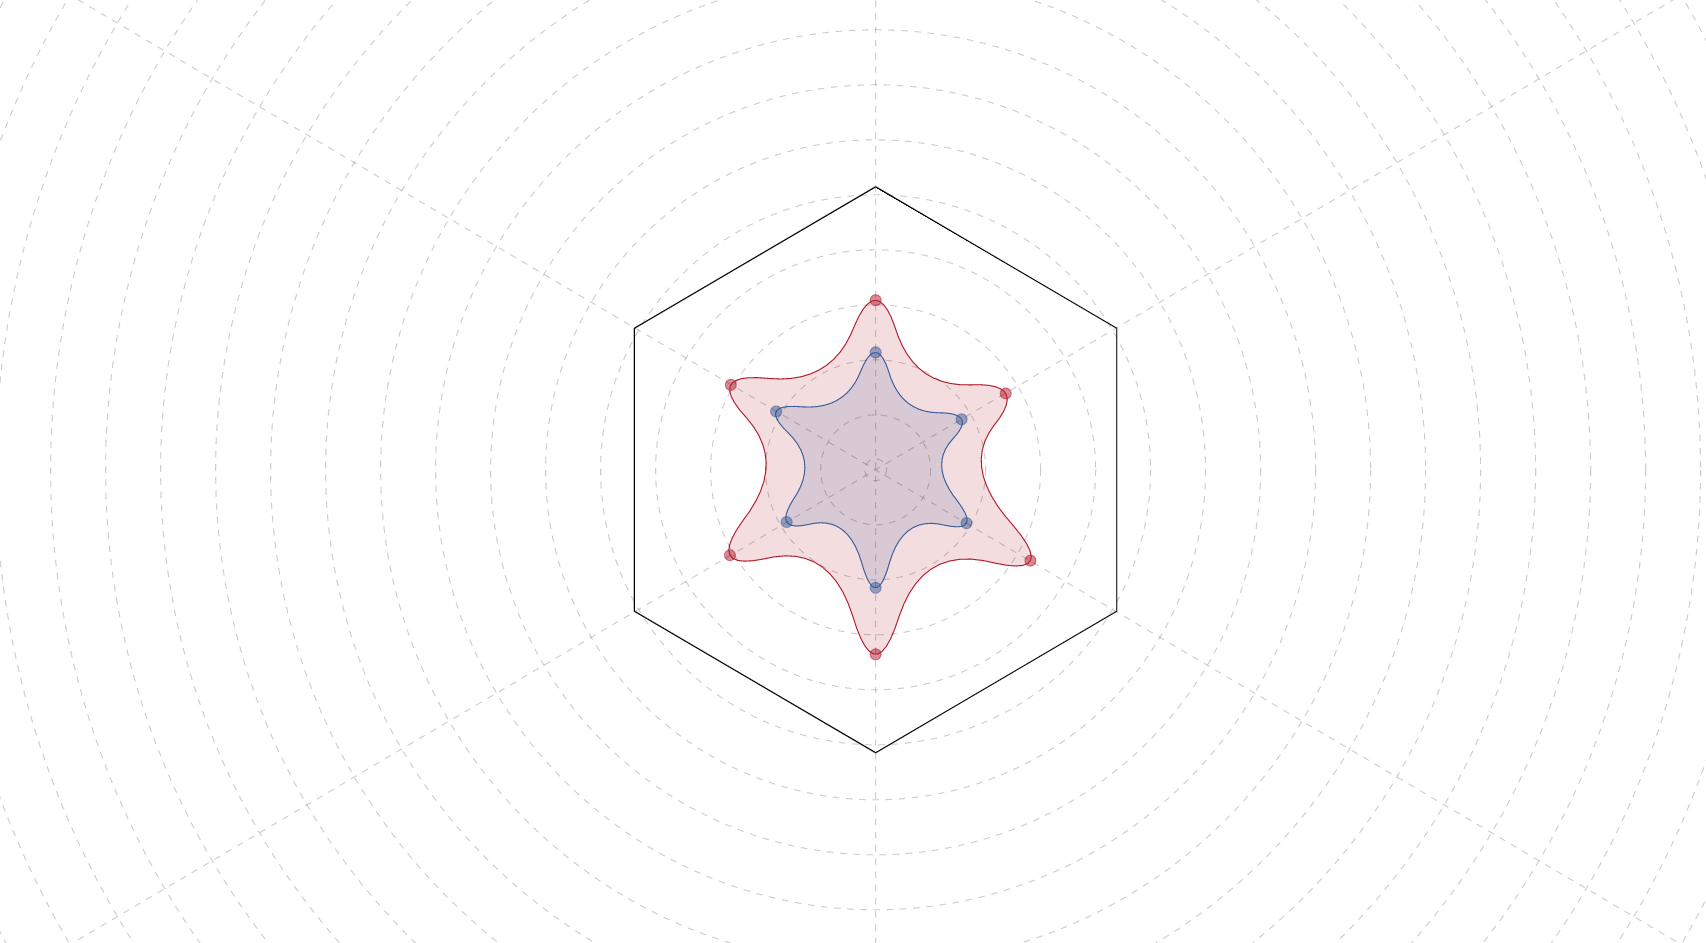
Metric Comparison
Per residue comparison of calculated contact metrics. Employs an interactive radar plot to display values.
Explore