What is ProLint?
ProLint is open-source and free to use. ProLint is developed by D. Peter Tieleman's research group at the University of Calgary. It is released and the entire source-code is made available under a GPL-3.0 License here: ProLint Repository
ProLint is a user-friendly framework for the automated
analysis and
interactive visualization of
Protein-Lipid
interactions.
The time requirement to analyze and interpret data generated through Molecular Dynamics (MD) simulations
usually exceeds the time to set up
and perform the simulations. Add to this the continuing trend of increased system sizes, simulated for longer
time scales and the need for a
much larger set of proteins, it becomes clear how analysis and visualization of lipid-protein interactions can
become a significant bottleneck.
ProLint aimes to bridge this widening gap between data
generation and
gaining insight on biologically-relevant interactions
between.
Objectives
ProLint, along with all of its accompanying tools, has the following core objectives and features:
Modular Analysis
Analysis is always context-dependent and users will have varying levels of interest for different aspects of the same data. ProLint recognizes this and implements several analysis protocols to account for it.
Interactive Visualization
The line between analysis and visualization becomes indistinguishable once users have the ability to interact with the data being visualized. The design of all visualization applications by ProLint is centered around user interactivity!
Automation & Scalability
Analysis and visualization of lipid-protein interactions is entirely automated. ProLint also provides a standalone python library that users can use to automate tasks and scale-up their workflow.
Accessibility & Shareability
Web-based visualization and cloud-based hosting allow ProLint to share MD results with the whole scientific community. Thanks to its intuitive visualization applications that require no coding knowledge or MD experience, the benefit of the shared data extends far beyond the computational community.
Applications Overview
Given MD files as input containing proteins embedded in a lipid environment, ProLint automatically analysis the interplay between lipids and proteins and visualizes their interactions using applications such as the following:
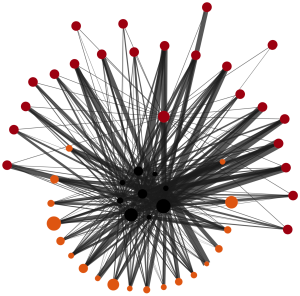
Network Graph
Lipids and proteins are represented as collapsible/expandible nodes and their interactions with each other as edges.
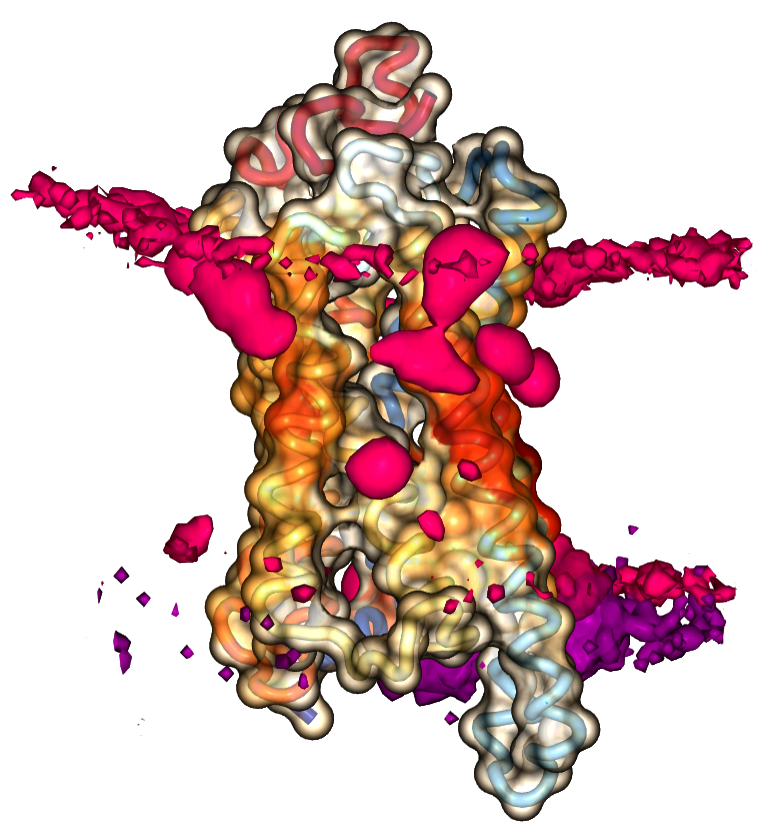
Heatmap Viewer
Interactive 3D visualization of lipid densities and projected contact heatmaps onto the surface of proteins.
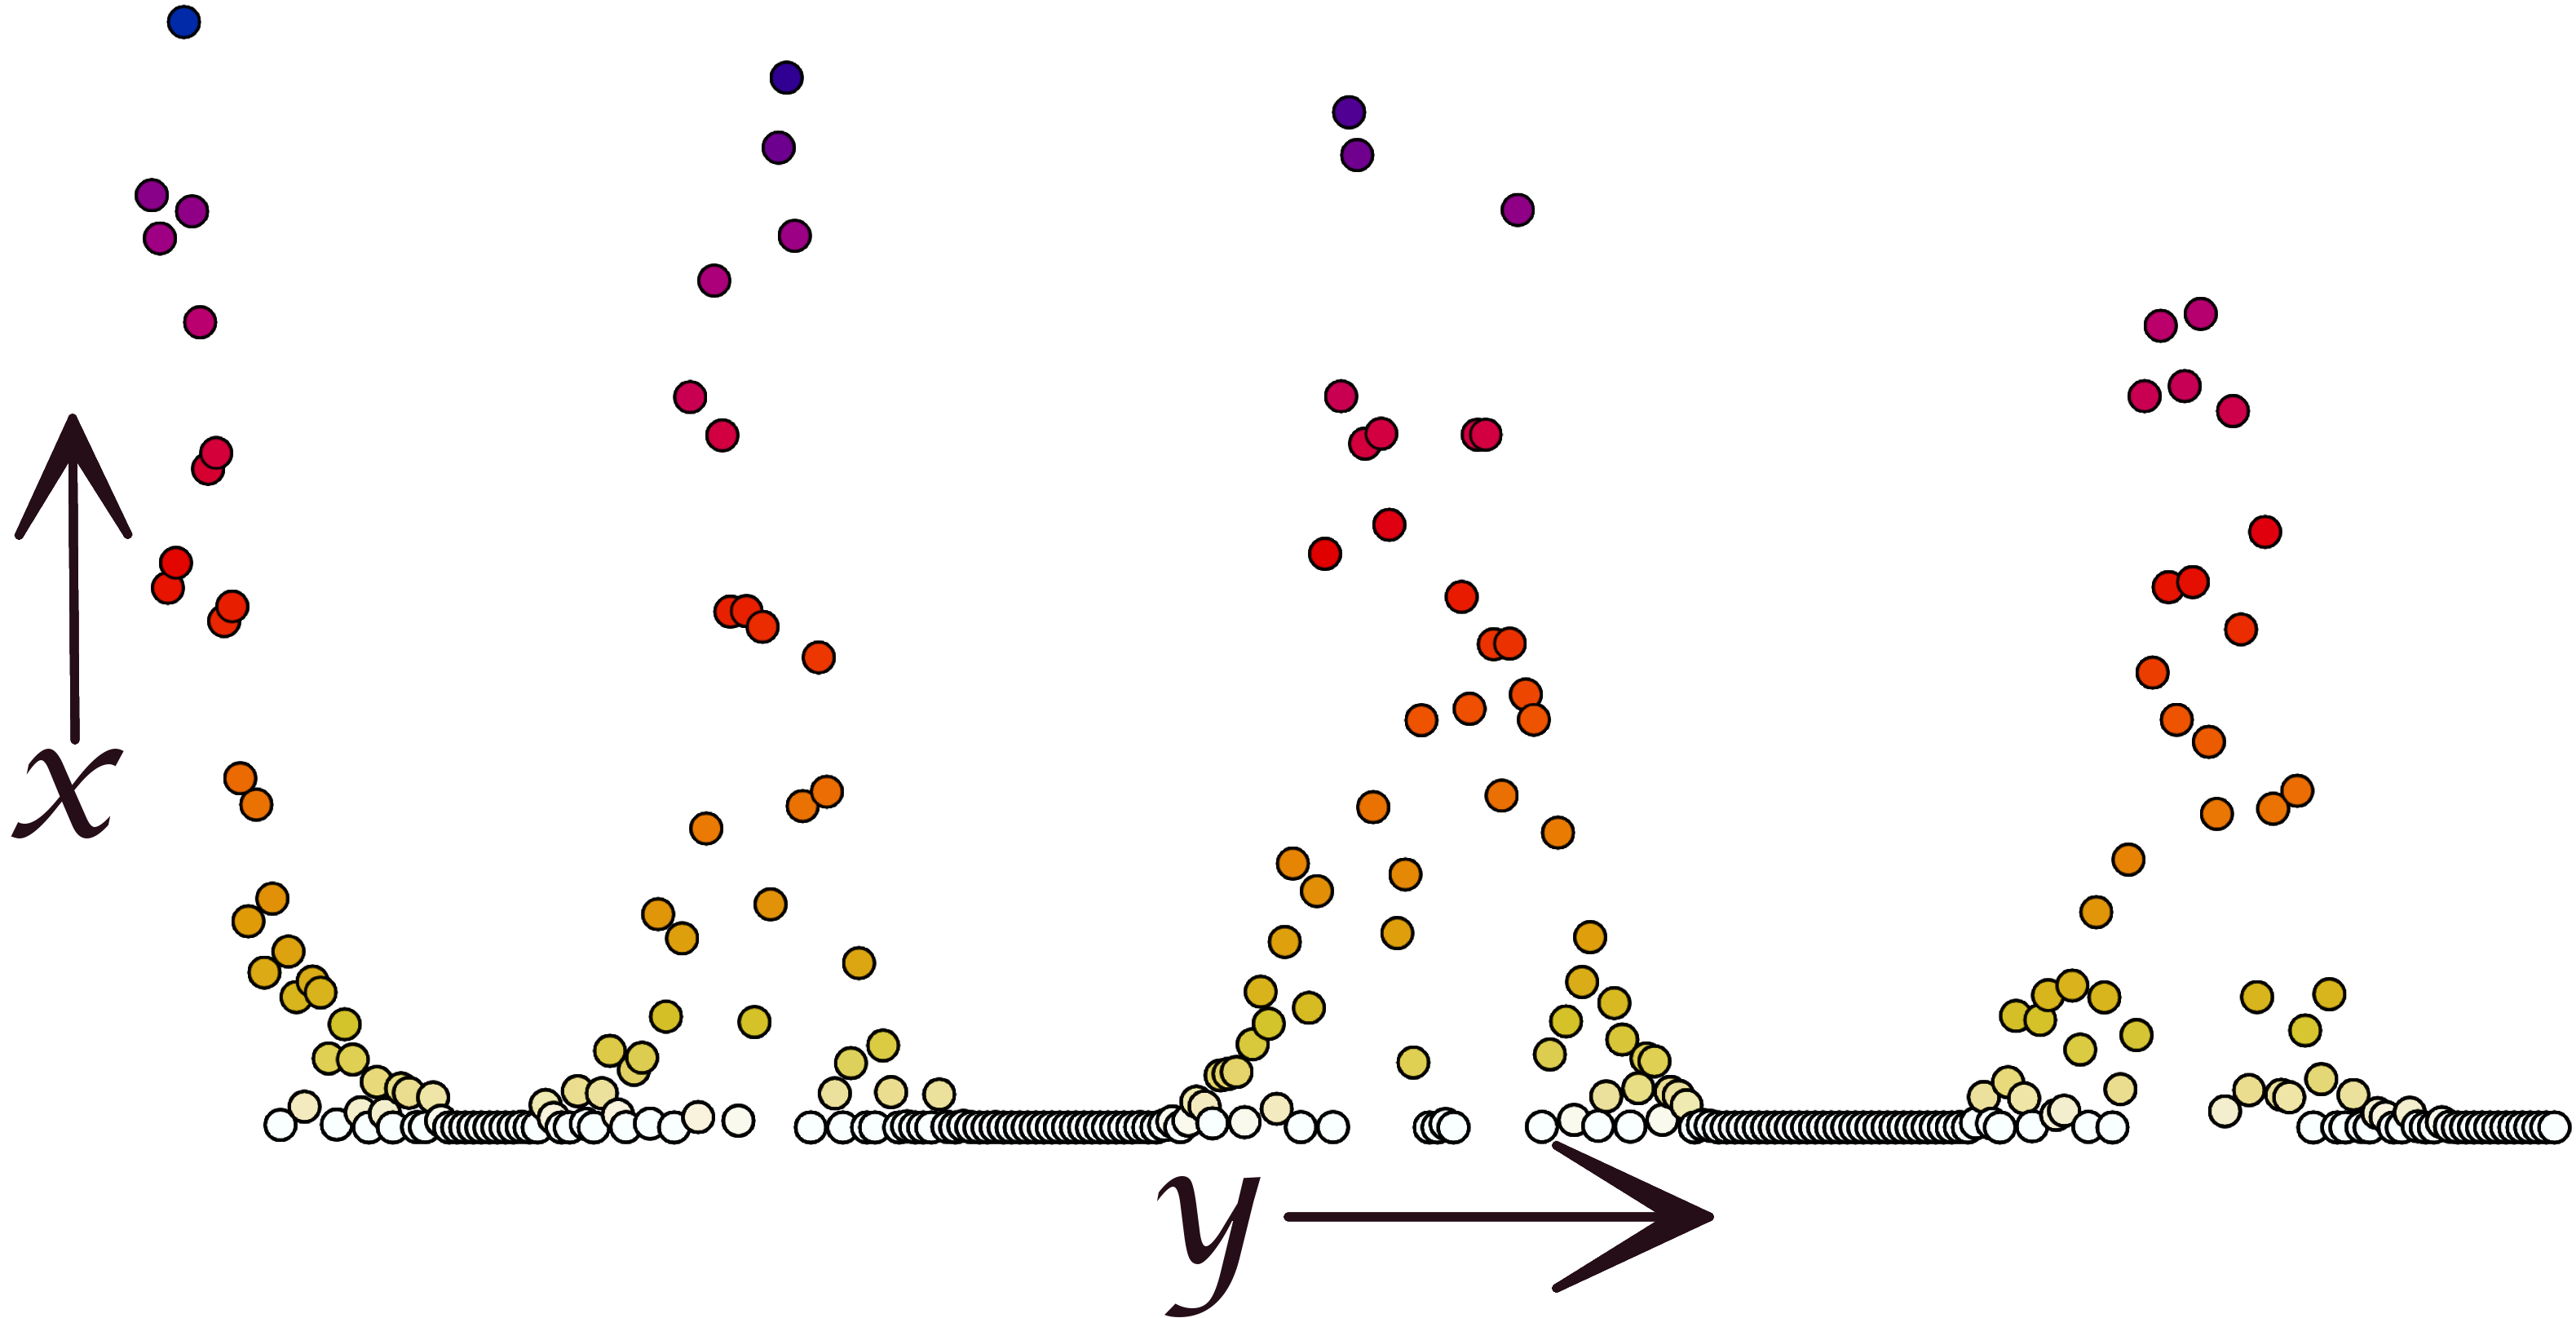
Point Distribution
Interactions visualized as a point plot where each point represents the interaction of one residue with a particular lipid.
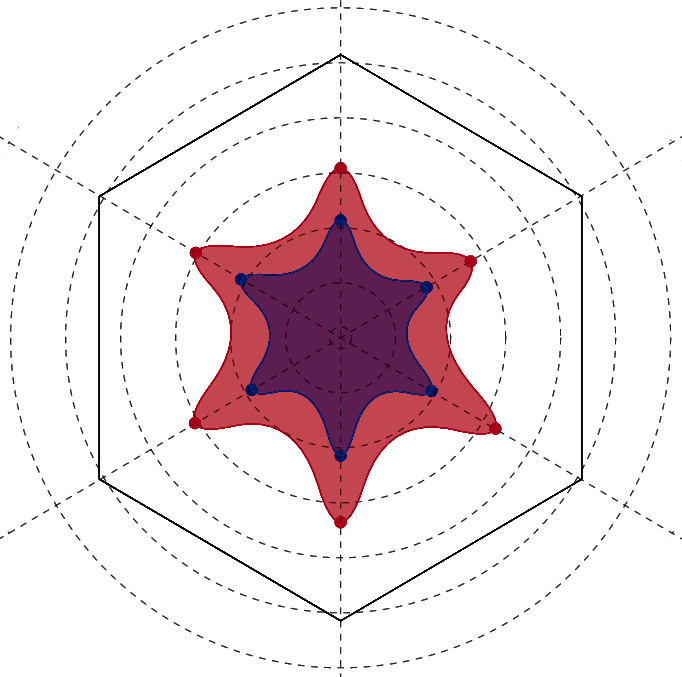
Metric Comparison
Per residue comparison of calculated contact metrics. Employs an interactive radar plot to display values for two residues at a time.
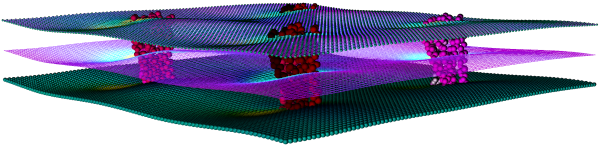
Thickness & Curvature
The changes that proteins induce in their surrounding lipid environment are displayed using thickness and curvature mesh files.
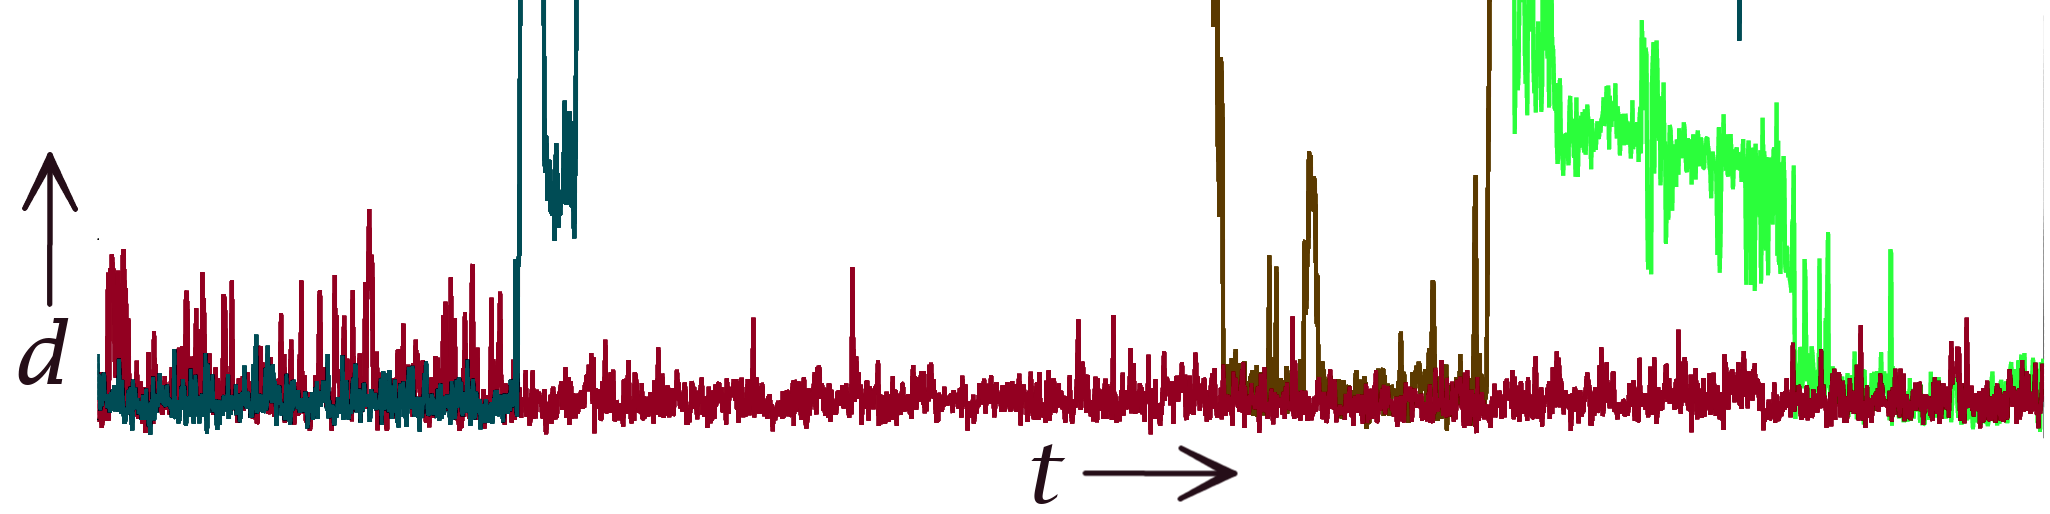
Distance Lines
Distance timeseries for the most high-scoring lipid-protein contacts.
ProLint is an open-source framework to analyze and visualize lipid-protein interactions
To get familiar with ProLint we highly recommend you read the provided documentation.
In particular, check out the tutorial section.
Testing & Tutorials
We recommend that before you submit any jobs to ProLint, you first familiarize yourself with its capabilities
and requirements.
Not all data files are supported and not every computational model is supported. ProLint has been tested and
optimized with the
Martini model. All lipids that are part of the Martini lipidome should work. ProLint provides the option to
submit atomistic data
too, but please be aware that this is, currently, an experimental feature.
For testing purposes, we provide several different input files that you may use. These files are located on the Resource -> Test Data
page of this website,
the following
Test Data page. .
Simply download the files for one system and size category and follow the instructions on the
tutorial page.
When you submit your data, you will be provided with a unique
ID that you can use to
access your data from the Results page for around 24 hours.
The GPCRs page of ProLint, contains a set of applications that
aggregate data
on the interaction of G Protein-Coupled Receptors (GPCRs) with lipid.
They highlight the full capabilities of the visualization applications implemented in ProLint.
Each application contains data for 28 different GPCRs with a complex (63) lipid environment.
Users can view, analyze and compare different aspects of the lipid interaction profile of these important
receptors.
Applications are highly intuitive and support many layers of interactivity without requiring any specialized
knowledge of lipid-protein interactions,
MD simulations, or coding experience.
Run ProLint Locally
Often, it may be necessary to run ProLint locally.
This is especially useful if your use-case requires the (i) definition of custom
metrics,
(ii) you require more fine-tuned analysis than is currently supported, (iii)
your files are too large and cannot be preprecessed further without loss of critical information,
(iv) you plan to incorporate ProLint within an automation workflow, and/or
(v) you plan to customize any of the visualization applications.
To account for these cases, ProLint provides a fully-fledged python library that can be installed and run
locally. It has full support for analysing lipid-protein interactions with a much more detailed control over the process and
implements all of the visualization application that are part of the webserver. It is released under the MIT license and is openly
available on the
ProLint GitHub repository .